
June 2014
|
The Mission of the Economic Development Administration (EDA) is to lead the federal economic development agenda by promoting innovation and competitiveness, preparing American regions for growth and success in the worldwide economy. The agency has a competitive grant process and has established the following investment priorities as criteria: collaborative regional innovation, public/private partnerships, national strategic priorities, global competitiveness, environmentally sustainable development, and economically distressed and underserved communities. Message From Assistant Secretary
|
 I am incredibly excited to join EDA at this critical time for our nation’s economic growth. As our country continues its recovery, EDA plays an important role in partnering with local communities to help them become robust regional engines for business creation and job growth.
 |
|
Roland Stephan, Associate Director, Higher Education & Economic Development, Center for Science, Technology & Economic Development, SRI International |
Roland Stephen is the Associate Director for Higher Education & Economic Development in the Center for Science, Technology & Economic Development at SRI International. He is presently a co-leader on four studies for the Economic Development Administration, Department of Commerce. He has worked on performance assessment in higher education and on regional economic development strategies. Prior to joining SRI, Dr. Stephen had seven years of leadership experience at the Institute for Emerging Issues (IEI), an applied policy unit at North Carolina State University, where he was also an associate professor in the School of Public and International Affairs. He has directed policy research, strategic planning, program design and public engagement in the areas of technology policy, higher education policy, and regional economic development. Dr. Stephen received his Ph.D. in International and Comparative Political Economy from UCLA and his B.A. in Economics and History from Cambridge University, United Kingdom.
Q1. SRI worked on an EDA University Center Best Practices Report. Can you talk a little bit about the goals of the report? How did data factor in? What data did you collect? What were the methods?
The overarching goal of the report was to review and inventory the various attributes and activities of EDA’s existing university centers (UCs) and identify the best practices that emerged from our review. We quickly found out that the 58 UCs were very, very different along every dimension – goals, activities, duration, funding, location, etc. Data of course would underlay our analysis, but because of the wide variation among Centers, it would be impossible for us to systematically collect the same quantitative information and rigorously determine a “best practice.” Therefore we approached the evaluation using mixed-methods – collecting quantitative information where we could, but relying on a qualitatively rich understanding of the UC to develop some “best practices.”
While EDA tracked the progress and deliverables of each individual UC, at the time there was no centralized collection of information on UC activities, so much of our effort was spent collecting data on UCs. Data ranged from institutional characteristics such as where in the university a UC is situated to details about activities and clients, and, of course, outcomes of centers and what centers themselves considered to be their best practices.
Because these programs are complex and nuanced, we gathered data three different ways – first we surveyed the UCs for basic information, then we visited all but one of the EDA regional offices to talk with staff and to obtain applications and reports. (We interviewed the Seattle office over the phone.) Based on the survey and regional staff member input we visited eight UCs spread all over the country. We talked with UC directors and staff and interviewed clients and stakeholders. Based on these visits we developed an interview protocol and we then interviewed every UC on the phone. Finally, we used a web survey to collect client and stakeholder feedback.
Q2. Building capacity through data analysis and GIS tools is one of the topics in the evaluation. Can you talk a little bit about the relationship between capacity building and data analysis?
Many public officials and economic developers do not have the capacity in terms of skill sets, or tools, or access to data to perform the economic analysis and strategic planning needed to understand and shape the economic development of their region. Economic development planning hinges on data – for example, data on population, workforce, industrial clusters, consumption patterns, residential profiles, etc. Much of these data are not available at the local level and are difficult for small communities and organizations to analyze. The University Center grant allows university centers to provide capacity to regions in support of community and regional economic development planning efforts. For example, many university centers have access togeographic information systems (GIS), which provide a geographic representation of data of interest. These maps enable economic developers to present economic data in a geographic space to support their activities. Alternatively (and sometime complementary), university centers provide access to data and training in analysis so economic development practitioners can do their own analysis.
Q3. How else are University Centers using data with regard to economic development? Are there any practices that might translate well to other economic development organizations or entities looking to do economic development?
Many Centers analyze the usual group of economic and workforce indicators needed in strategic planning; however, a few other centers are using data in other interesting ways. The University Center at Kansas State University, hosted by the Advanced Manufacturing Institute (AMI), established the Kansas Opportunity Innovation Network (KOIN). Its mission is to enhance the global competitiveness of rural businesses by providing access to innovative ideas, new markets, expertise, capital, and collaborations, independent of close geographical proximity. KOIN has developed new regional innovation tools and uses this knowledge to support local and regional businesses through in-depth market analyses that complement the large-scale new product development services for which AMI is widely known. These complementary services allow AMI/KOIN to enhance the global competitiveness of rural/distressed companies and regions in Kansas.
In support of its mission, KOIN’s strategy includes profiling innovation competencies, assets, capabilities, and needs of regions, communities, and local companies to scout new opportunities, especially global opportunities, outside existing markets where clients may have little or no connections. KOIN also maps networks of technology providers, expertise, capital, and potential business partners that possess complementary competencies that can enable Center clients to respond in a competitive manner to readily connect and combine opportunities, companies, communities, and regions in innovative ways. KOIN’s work has included a quantitative key industry analysis and a quantitative regional innovation assessment for Kansas counties. One study mapped where workers reside versus where they are employed to illustrate regional inter-connectedness. Another study produced unique data visualization of industry concentration including location, number of firms, employment, and sector.
Another view of data is internal data – the tracking of activities varies among university centers. A longitude tracking of clients and engagements not only helps a center report on their activity, it also can keep track of network participation. For example, the Center for Economic Development at California State University, Chico and California State University, Fresno uses an off-the-shelf Customer Relationship Management software to log every client interaction. All Center employees have been trained to include the details describing the interaction and the work product provided to the client. Analyzing client patterns has allowed the Center to predict when certain clients are likely to request specific kinds of data. It also provides an audit trail that is useful for problem solving.
Both of these practices could be translated to other economic development practitioners. It is important to know one’s region – it is important to get out and about to know one’s area, but it is also important to look at the data to find competencies and networks that you may not see. Regional and local data collected by third parties and the microdata collected by your staff may reveal a larger picture.
SUCCESS STORY
Mining Data for Golden Economic Opportunities
|
The Port of Gloucester |

There are a few things that are consistently drilled into us throughout our education. We’re told from a young age to always check our work or proofread our papers. We are also instructed that we should say “may I” instead of “can I.” Most fundamentally, across any and all subjects, we are taught the importance of data. While it isn’t always referred to as such, data is the supporting argument in an essay, it’s the showing our work in math, and it’s the basis of defending any theory.
In 2008, the Port of Gloucester, Massachusetts, was at a crossroads. The harbor, formerly the heart of the city, was contributing less than 1.5% to the tax revenue for the city and the fishing industry had shrunk by 80 percent over the previous 25 years.
In a 2011 Harbor Economic Plan, the community established a framework for understanding the waterfront economy, as three intertwined and mutually supportive strands: the fishing industry, the visitor-based economy, and a nascent maritime economy. A 2011 visit from an EDA Assessment Team encouraged the city’s approach to diversifying its economy.
The EDA granted the regional planning agency and the city funding to host a two-day Maritime Summit to explore the emerging target sector. At the summit, the community found extensive regional knowledge-based ocean innovation activities.
Many groups split off to explore avenues for growth. The community brainstormed an array of new marine uses for a vacant parcel owned by the city, and subsequently funded focused workshops for a marine innovation center. The Fisheries Commission began a thorough documentation of all dockage and potential dockage in the working port to ensure the continued compatibility of the new uses without displacement of the fishing fleet.
In its 2014 Harbor Plan, the city and its Harbor Plan Committee outline the need for an economic strategy based on a detailed understanding of the local assets, to include a maritime sector opportunity analysis and specific economic attraction strategies. The plan is expected to be completed later this month.
The city has nearly a third of its job market in the maritime economic sectors, from fishing, processing, biology, and food sciences, to whale watch boats, schooners, and summer tourism. By clarifying its target markets, the city has enlisted state cooperation in contemporizing the zoning on the harbor, and is attracting financial partnerships for waterfront development.
The waterfront is seeing results. Ocean Alliance, a research institute that studies whales and human impacts on the marine environment, purchased, restored and currently occupies a former Paint Factory. Construction has started on two remaining brick buildings, one of which will host a robotics laboratory, and a local developer has made a $20 million investment.
The community values its working waterfront, and had a theory that 400 years of “Going down to the Sea in Ships” provides a platform for 21st century ocean innovation. Each step of data collecting has focused that theory and enabled waterfront growth and development.
SPOTLIGHT
New Tool Available: EDA’s Cluster Map & Registry Tool
EDA staff gets inquiries daily from different organizations looking for grant information. Every community we speak with has a plan it is developing to spur economic growth and create jobs. Some are more fleshed out that others, but EDA’s advice is always the same: look at the resources in your community and make sure this project fits with the economic strengths of your area. In short, identify your regional clusters.
Clusters are geographic concentrations of interconnected industries and supportive organizations that make regions uniquely competitive for jobs and private investment – like the automotive cluster in the South and the biotech cluster in the Northeast. Clusters are not top-down formulas aimed at being a panacea for all economic development needs. Nor are they intended to serve as a litmus test for qualifying or strictly characterizing good or bad projects. Clusters thrive and are critical in both urban and rural communities and provide a framework for understanding regional competitiveness and drivers of private investment and job creation. They also help identify and prioritize opportunities for public investment and provide a platform for linking, leveraging, and aligning federal or state programs to get a better return on investment of taxpayer funds.
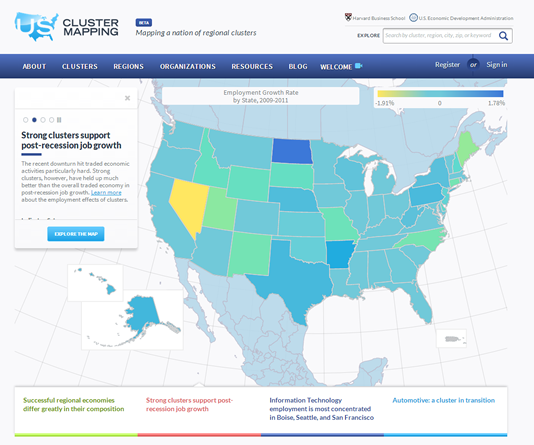
Every regional economy has its own distinct profile of clusters, and now EDA has a tool to help communities identify theirs. This week, EDA launched the U.S. Cluster Map & Registry tool . EDA supported the U.S. Cluster Map & Registry Project at the Harvard Business School’s Institute for Strategy and Competitiveness (ISC).
The ISC, along with core partners at MIT Sloan School of Management and Temple University’s Fox School of Business conducted state-of-the-art academic research on clusters and created a public-facing website to provide business, government, and other interested parties information about clusters across the U.S. The interactive website offers access to cluster data and regional statistics covering the entire U.S. economy across 30 different economic indicators. The registry also offers a community network for users to contribute resources and news about economic development, policy, and innovation; identify partners; and share and discuss best practices and activities. The registry is open to all organizations, and there are already more than 1,200 organizations participating in the network.
The U.S. Cluster Map & Registry provides new insights on the role of clusters in driving regional economic outcomes. It looks at the regions whose clusters are denser than average to identify national clusters. Making this cluster data available will assist communities seeking to do economic development, businesses looking to expand, and researchers hoping to better understand regional economic drivers.
EDA is proud to launch this next tool in our economic development arsenal. The projects EDA funds help communities grow and strengthen their local and regional economies. However, funding without an informed plan can’t drive meaningful economic development. The pen is mightier than the sword, and data is mightier than the dollar.
HIGHLIGHT
Grading EDA’s University Centers
EDA Releases “Making Connections, Evaluation Project to Assess Best Practices in EDA’s University Center Program”
|
Map of distribution of University Centers in the Continental United States |
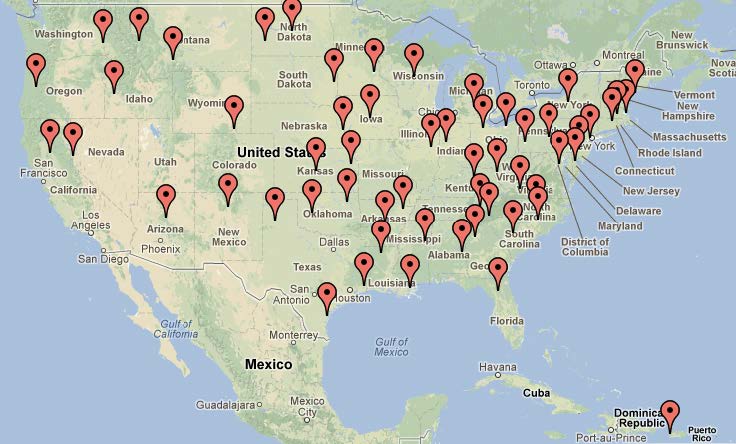
EDA funds a number of projects and tools to help communities and regions evaluate their economic opportunities and help them build capacity. The tools are intended to assist with economic development, but sometimes it’s challenging to really measure the impact of a project. Thanks to an in-depth analysis of EDA’s University Centers (UC), we now have some valuable information assessing the best practices of this particular endeavor.
The goal of the University Center program is to provide resources to develop, implement, and support regional strategies to promote job creation, the development of high-skilled regional talent pools, and business expansion in a region’s innovation cluster. It’s about boosting capacities and capabilities. In short, EDA is aiming to mobilize higher education behind the needs of the U.S. economy.
The University Center program began in 1966 and was re-launched in 2004 to make it more competitive. EDA, under its Research and National Technical Assistance program, conducted a formal evaluation and collected data on the performance on the University Centers to better understand the impact of the program. EDA engaged SRI to develop the framework and conduct the evaluation.
As the evaluation got underway, SRI realized that there were going to be some challenges with conducting an evaluation. Namely, each of these centers is fairly localized, and while the services are often similar, they are provided in specialized ways to be responsive to the needs of the local community. As part of the evaluation, SRI conducted an inventory of all services and the ways they are provided by each of the UCs.
In addition to looking at the services themselves, SRI surveyed UC staff, stakeholders, and customers to figure out what the most valuable and in-demand services are. For local governments and economic development organizations, UC’s can tap into academic expertise to assist with data analysis, impact studies, GIS toolkits, and a number of other technical assistance services. For existing businesses and entrepreneurs, UC’s can provide a range of services including process improvements, legal services, and commercialization. One of the most important services UC’s provide to the business community is acting as a conduit to the expertise of faculty and students in a wide range of fields such as engineering, law, marketing, and computer science.
Based on that data, SRI was able to develop best practices for services across the program to influence and improve national services. Additionally, SRI developed one-pagers highlighting the focus and successes of each individual UC to highlight the local work and impact of each center.
Read the Making Connections, Evaluation Project to Assess Best Practices in EDA’s University Center Program (PDF) to learn more about the program and how your organization can use this important resource.
|
|
|||
In This Issue
Know a business that wants to move jobs back to the U.S.?We encourage you to get in touch with your EDA regional office to find out how we can help! Share your Vision for Greensboro, Las Vegas, and HartfordThe SC2 Economic Planning Challenge is a key component of the Obama Administration’s Strong Cities, Strong Communities (SC2) initiative and includes competitions in which the cities of Greensboro, N.C., Hartford, Conn., and Las Vegas, Nev., are challenging teams to come up with new solutions to strategic economic transition planning in each community. Got ideas? Register today and help revitalize a local economy. Winning teams receive a cash prize. Workforce Grants Available Through the U.S. Department of LaborThe U.S. Department of Labor has made up to $53 million in grants available through the Workforce Innovation Fund. This is an initiative designed to strengthen public job training programs by delivering employment and training services more efficiently and effectively, facilitating greater cooperation across workforce programs and funding streams, scaling best practices, and implementing rigorous evaluation techniques. Workforce Innovation Fund grants will invest in both the scaling of proven ideas and the development of promising ideas that are being implemented for the first time. Applications are due by Wednesday, June 18, 2014, and awards will be made in September 2014. To access this Solicitation for Grant Applications announcement (SGA/DFA PY 13-06), please visit http://www.grants.gov. Additional grant information is also available at http://www.doleta.gov/grants/. Commerce Announces What’s NEXT for the National Export InitiativeCommerce Secretary Penny Pritzker recently announced that the Obama Administration will build on the success of the National Export Initiative (NEI) by launching NEI/NEXT: a new customer service-driven strategy with improved information resources that will ensure American businesses are fully able to capitalize on expanded opportunities to sell their goods and services abroad. NEI/NEXT will help more American companies reach more overseas markets by improving data, providing information on specific export opportunities, working more closely with financing organizations and service providers, and partnering with states and communities to empower local export efforts. Learn more by reading the Secretary’s blog announcing the launch. Careers at EDA |
