
Archived Content
This site contains information that has been considered archived and will no longer be updated.
Highlight: StatsAmerica: Energizing Your Region’s Economy with Innovation Index 2.0
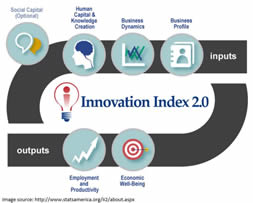
EDA’s most recently developed tool is StatsAmerica’s Innovation Index 2.0 (II 2.0). Developed by the Indiana Business Research Center at Indiana University and funded by EDA, this tool provides practitioners an easy-to-compare method of assessing the innovation capacity of their region with data from four areas: human capital, economic dynamics, productivity and employment, and well-being.
You may ask, “What is driving innovation in my region?” or “How does my region’s economic landscape compare to other regions?” The new Innovation Index 2.0 can help answer those and many other questions.
The new II 2.0 is more comprehensive than the previous innovation index. II 2.0 expands on the original index by adding more than 50 new measures, such as taking into account regional knowledge spillovers, technology diffusion and foreign direct investment. Similar to the first version, county-level data can be aggregated to a regional level based on the user’s needs. These measures reflect contemporary research on understanding and measuring innovation.
The Innovation Index 2.0 also provides a set of analytic tools and data that can help regional leaders reach a strong consensus on their region’s strategic direction. Data and analysis can inform stakeholders’ collective action toward a common vision and can guide complex decision-making at a regional-level by identifying region’s capabilities, challenges, and potential.
Developing regional economic development strategies requires a great amount of data and analysis, which many economically distressed communities cannot afford on their own.
The IBRC, thanks to the EDA, provides these data and resources to communities at no cost.
The tool is engineered for drilling down into detailed data as well as cross-regional analysis. Users can focus on a single area (Overview) or a multi-area comparison (Comparisons). A nationwide mapping widget allows you to see every county or region in a heat-map style – even allowing the user to select a county or region as the “comparison point,” against which all other counties are measured.
The user can compare a county or region side-by-side with other, similar geographic units, and capture the data in a spreadsheet or PDF file. Values and ranks can be downloaded by county, metropolitan statistical area (MSA) and Economic Development District (EDD).
The tool presents complex data simply, somewhat like a dashboard gauge. Understanding what the dashboard is showing was the main focus of an EDA webinar on February 2, 2017. In this webinar, we demonstrated how to compare a country/metro/EDD against other benchmark or peer regions that share similar characteristics. The Map Tool can be used to view, spatially, each one of the Innovation metrics, such as STEM, prime working age population, per capita income or business incubator spillover effects.
For more details on how the II 2.0 was built and how to use and understand it, please refer to the report which is available here (PDF).